The Brazilian real-money gaming scene has been the talk of our industry for a few years, ever since sports betting was declared legal. Brazilian players have responded really well to our online casino platform, spurred by consistent digitization and a rapidly recovering economy.
Our research team looked into the biggest gaming communities and most active states, as they drive market penetration and prove the nation’s fondness for online gambling. Based on our own primary data and publicly available statistics, we validate our findings and identify the factors which make online gaming for real money more popular in these areas.
Overview of Findings
Based on the segmentation of our aggregate data on user activity, we identified the following peak territorial usage trends of online casino and sports betting products:
- – KTO gets the best online traction in Southeastern and Southern states of Brazil, boosted by big metropolitan gamer communities;
- – Most gaming sessions originate from São Paulo and Rio Grande do Sul;
- – The top 6 online gambling states are completed by Minas Gerais, Santa Catarina, Paraná and Rio de Janeiro.
The above findings have found confirmation in a series of regional factors, ranging from demographics to economic development and online media exposure. Cultural specifics also come into play but they merit a separate case study exploring Brazilian gambling culture.
Online Gaming Communities Most Active in the South and the Big Cities
Several years ago (2017), the Brazilian iGaming market was estimated at around USD 2.2 billion. KPMG’s analysts had those roughly split 60/40 between sports betting (USD 1.3 billion) and online casino games (USD 0.9 billion, including games like poker and bingo).
With post-Covid hindsight, these figures are surely an underestimation at present. The booming digitization has helped modern society shift away from a purely physical economy, with an impact on consumption models – more diverse, mobile and virtual than what could have been imagined during the mid-2010s economic slump.
On one hand, the largest Latin American economy (and stably in the top 10 globally) is no longer a sleeping giant. It is expected to keep growing for the foreseeable future, boosted by “vigorous employment growth”. A thriving economy has its positive effects on disposable income and consequent rise in demand for services such as paid digital entertainment.
On the other hand, Brazilian attitudes towards digital gambling have also changed in the past decade. Emphasized by the formal legalization of sports betting in 2018, the real-money gaming scene now awaits the adoption of precise rules, definitions and protocols for licensed operators in the country. Market experts have their sights on the new government, with 2023 possibly bringing the much-awaited detailed regulations.
Ultimately, all of the above elements make up for a nation that is destined to become a global leader in online gaming. The question at hand is just how much current demand for online gambling is there across Brazil and where does it come from.
As we will see in the detailed datasets below, bigger cities (and naturally, states) inevitably have more influence on the nation’s gaming culture, online casino and betting activity. The Southeast and the South dominate rankings (the first state located above the Capital Brasilia is Bahia in 8th place).
For us at KTO in particular, this has been the result of successful promotional campaigns resulting in more brand loyalty. However, the better developed States and metropolitan areas clearly tend to convert user demand more efficiently into actual gaming sessions.
How Was the Study Carried Out?
The aggregated big-data series cover the period between November 1, 2021 and November 16, 2022. In a timeframe of slightly over a year, KTO.com has registered the following levels user activity on its platform:
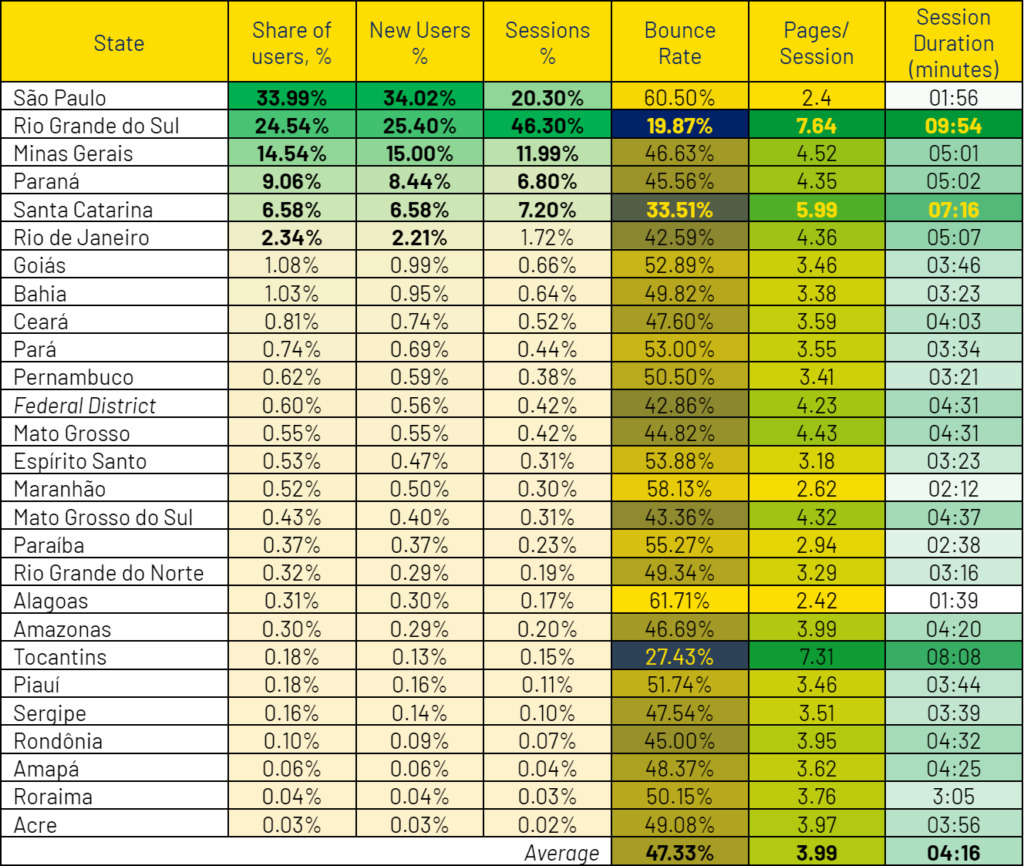
Segmented by geographical origin, we can see that some States stand well above the rest in terms of users (both new and repeat) and effective gameplay sessions. It cannot be a surprise to see São Paulo on top of the user count ranking, provided that it has more than double the population of any other State in the nation.
São Paulo distinctly draws the most users on KTO. Although in a slightly different order, all of the top-rated States are well populated ones.
The first indicator that sees Rio Grande do Sul take the lead in terms of user sessions is the lowest bounce rate among all the federal units in the study. The fact that its residents rarely abandon the site after a single page visited is also confirmed by the highest average number of pages per session – 7.64.
Similar user experience (UX) indicators are registered only in players from Tocantins (7.31 pages) and to an extent Santa Catarina (just below 6 pages per session). These three states have the lowest bounce rates and the longest times spent on the platform, as well.
And while Santa Catarina is ranked 5th, Tocantins is kept far from the leaders because of its modest population numbers, as well as its lower levels of economic and overall development.
Further down, we illustrate how these non-technical factors boost the position of Minas Gerais, Paraná and Rio de Janeiro, all coming right after the leaders São Paulo and Rio Grande do Sul.
User Behavior Measured by Successful Player Conversion
The efficiency of KTO as an operator is illustrated by the rate with which it converts user visits (clicks) to an actual platform registration. As a next step, it is important to see how many of these registrations are channeled to a successful first-time deposit (reg-to-FTD).
The average reg-to-FTD is as high as 50.48%, arguably proving the user-friendliness of the platform. Rio de Janeiro and São Paulo boost their rankings mostly because of solid registrations and the sheer population within their borders. The volumes generated by Rio Grande do Sul, Santa Catarina, Minas Gerais and Paraná also put them among the leaders.
Ultimately, these conversion rates increase the gap between the top 6 and the rest when it comes to FTD by unique users), as well as the proportion of net gaming revenue (NGR).
Average revenues per user also differ quite a lot between the states. Weighted NGRs are shown below by state, compared to the national average.
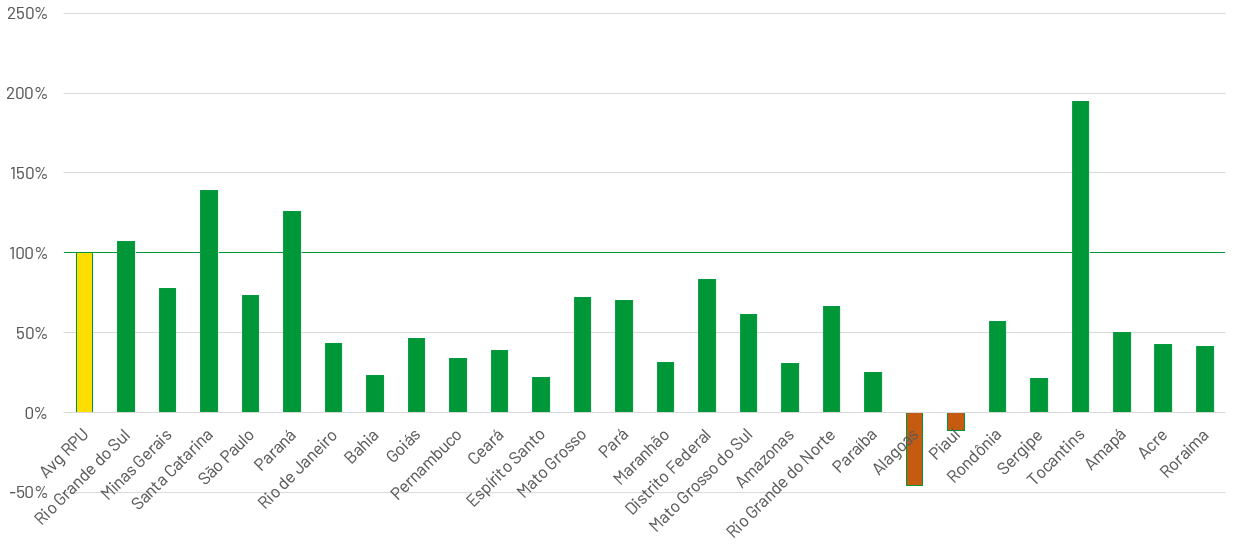
We can see that Santa Catarina and Paraná residents generate more net gaming revenue per user, based on FTD amounts alone, while Rio Grande do Sul is also above the national average.
Tocantins is an outlier, since it has only a minor share of registered players and modest performance indicators in any other category. User NGR that is double the national average is obviously the result of high-rollers being active in the state. Similar considerations are due for Alagoas and Piauí, although with a reverse sign. The already limited number of players seem to have won more than they have deposited.
Validation of Trends through External Sources
One factor that inevitably influences user traffic by state is the population within that Federal Unit. However, much of the digital literacy and online gaming habits of the local residents depend on their disposable income (regional economic development) and the presence of concentrated urban culture.
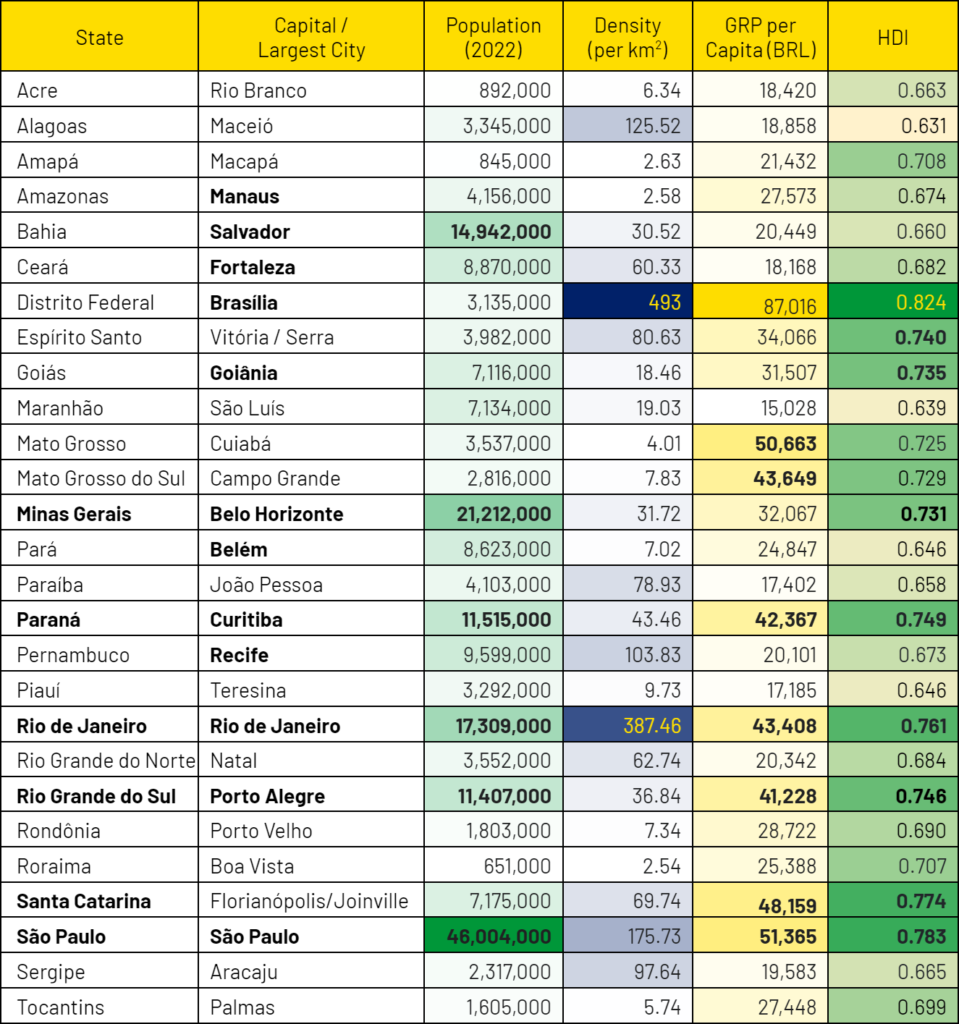
In terms of user volumes, we see a confirmation that five of the six top-performing states on KTO (in bold on the left) are all among the leaders in terms of overall population. The fourth largest, Bahia, comes soon after them in online traction.
Santa Catarina is the 10th most populous state but comes within the top 5 on KTO because of higher levels of economic prosperity (3rd best outside the Capital). Under standard conditions, this can be measured through the gross regional product (GRP) per capita, provided by 2020 Government data.
All states that stand out in KTO data have GRP levels above the Brazilian average of 35,936 BRL per capita, with most reporting figures above 42-43 thousand reais. The few notable omissions – the Federal District, Mato Grosso and Mato Grosso do Sul – are not in the top 6 simply because of their low population.
In addition, overall development levels are often expressed in terms of the Human Development Index (HDI, applicable to both nations and states). Brazil’s composite ranking also looks beyond income, combining state results in education levels and life expectancy as indicators of general well-being. Yet again and not surprisingly, behind the capital region (Distrito Federal), 7 of the next 8 States in that ranking coincide with the ones that provide the most sports betting and online casino players on KTO. (Espírito Santo is at #7 in the HDI list but it has less than 4 million residents).
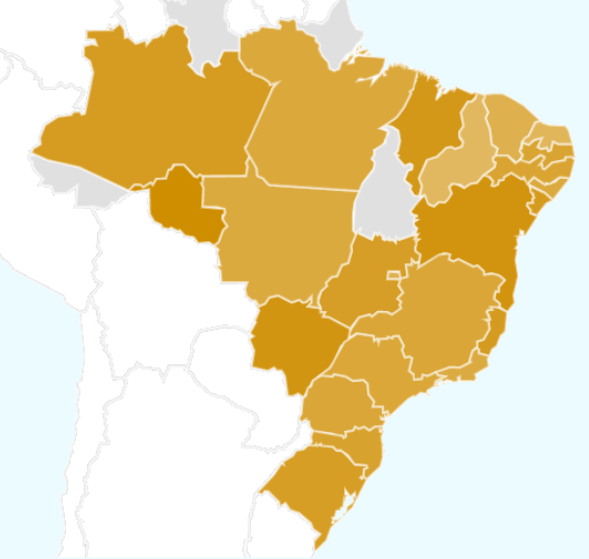
Below is a graphical representation of online gaming traction on KTO by Macro regions. The Central-West region is behind the North due to population differences, more than anything else.

Last but not least, online traffic is more intense in metropolitan areas. Brazil has quite a high level of urbanization – reportedly over 87% of the population resides in urban and metropolitan areas.
The most populated state, São Paulo, alone has 3 urban agglomerations within the top 10 (Guarulhos and Campinas besides the homonymous state capital) and 9 in the top 30. Hence, its dominance in user count is not surprising.
All of the others in our top 7 have large metropolitan areas, with Rio de Janeiro, Belo Horizonte, Porto Alegre, Salvador and Curitiba all in the top 10.
The Technological Factor
Naturally, the fact that Brazil’s population is young and tech-savvy also boosts the proliferation of online entertainment. Only 10.3 percent of the nation’s population is aged 65 and above, while 22.3 percent is between 13 and 64 years – an active digital, gaming and sporting age without a doubt. However, we do not need to delve into the age (or gender) structure of states, as the above macro factors prove sufficiently why certain regions and cities stand out in our study.
What we do need to take a look at are the levels of digital exposure across Brazil, as well as within separate States and regions. Currently, national internet penetration is reportedly 81%, as per World Bank data amounting to 173 million internet users.
While these rates are average in relation to global rates of internet subscriptions per capita (both mobile and fixed), Brazil still ranks 5th in the world in terms of total mobile connections – 206 million or 97 per 100 residents (after a peak of 138/100 in 2014). Therefore, the infrastructure is present and well developed, with access to digital communications and services readily available.
Mobile internet coverage and speeds are crucial since two thirds of online traffic passes through mobile connections. In most States, mobile internet is adequate for the main patterns of daily online consumption. However, there are some divergences, as the graph below suggests for the median download speeds by State.

While the map is based on 2021 data, it is still indicative of the regional differences in the quality of mobile internet coverage. Rio Grande do Sul, one of KTO’s most consistent performers, had the highest median download speeds of all the nation, followed by the Federal District, São Paulo, Paraná and Santa Catarina. Once again, these are all in the top 5 of user registrations, FTDs and NGR shares.
By late 2022, 5G has fully rolled out in the capital, as well as in the main metropolitan areas – the likes of São Paulo, Porto Alegre, Curitiba, Rio de Janeiro and Belo Horizonte. These push median speeds much higher in statistical terms, being the home of a large portion of the Brazilian population. Average speeds reach 115 Mbps, boosted by the high-tech reality of the biggest state capitals.
In this kind of digital economy, recent surveys show that 37% of Brazilian consumers use their internet access for online gaming, while 25% prefer downloading them. Other studies cite as much as 45% of online users enjoying gaming on a regular basis.
Google Trends on Online Casino and Sports Betting in Brazil
As most of our readers would know, the Trends feature of Google can show the locations in which certain search terms are most popular during a given time frame. Going back a year to match the above datasets (December 2021 to December 2022), we see the territorial distribution of search activity for the generic queries “apostas online” (in blue) and “cassino online” (in ochre).

We can clearly see that the demand for these two macro categories in the real-money gaming scene do not overlap for the most part. In fact, their graphical representation (as a fraction of total searches by State) show often an opposing trend in popularity.
In absolute query count, “apostas online” scores (much) higher than “online cassino online” in most States. Google does not have any data for Acre and Roraima – both at the bottom of KTO rankings – as well as for Amapá and Tocatins for “cassino online” in particular.
It is interesting to note the opposing interests among local residents for the two types of wagering, seen in the table below.
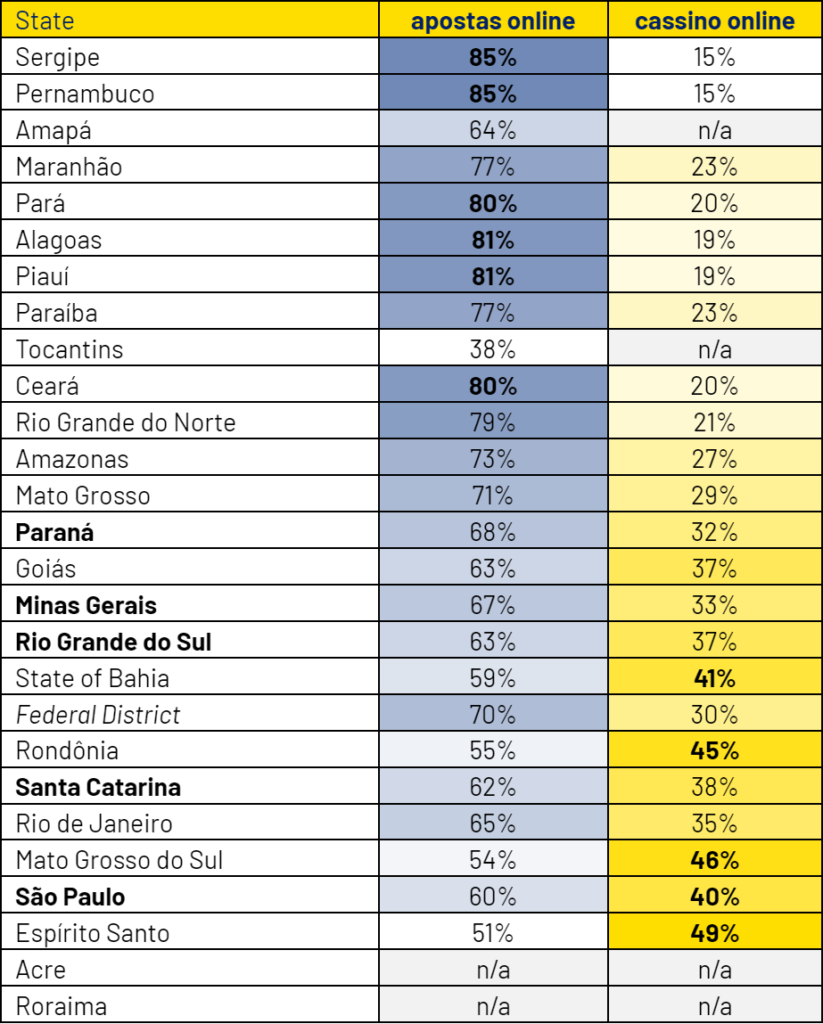
We see that States that show a passion for sport betting have lower interest in online casino. The contrary is also generally true, at the opposing end of the table.
However, the states which are most visible, active and well-performing in all of original KTO indicators and rankings – shown in bold above – tend to have a more even distribution between the two real-money gaming categories. Even when sports betting rates on average 20% above online casino games, it is much closer to its counterpart, scoring around 40% of relative search activity.
This last particular trend, as we have noted above, deserves to evolve into separate in-depth studies on player tastes, cultural specifics and most popular real-money gaming genres.
Conclusions
KTO aims to be transparent with its players, to educate online gamers and to serve as an example in the iGaming industry. That is why it is especially important for us to understand users, starting with their origin, interests and online behavior.
Our research team has broken down a year of anonymous aggregate data to find out which Brazilian states are most active on our platform and which of those manage to convert player activity into actual gaming sessions. We also sought the reasons for their performance, as this will be used by KTO to improve UX across the platform.
Perhaps unsurprisingly, the biggest States occupied the top positions, albeit not in the absolute order of their population ranking. The list is rearranged by factors like economic development, digital literacy, tech infrastructure and mobile communications within the state’s territory.
Crucially, the larger and better-developed metropolitan areas have more impact on online traction. Their residents determine a young and dynamic online gaming culture which is likely to firmly place Brazil among the giants of the iGaming market for years to come.